The most important aspect of any marketing or advertising campaign is tracking it effectively.
DOT offers the tools to track performance across several KPIs and optimise ad performance. If you are running a DOT campaign, viewing our Guide to Set up Ad Tracking might be helpful before continuing below.
Impressions
Definition: How often your ad is shown. An impression is counted each time your ad appears on a DOT partner website.
What to look out for: Impressions indicate the scale of your campaign. You must match your marketing budget with your marketing aspirations. Understanding the number of impressions typically required for each conversion is a great starting step.
Clicks
Definition: A marketing metric that counts the number of times users have clicked on a digital advertisement to reach a website or landing page.
What to look out for: Clicks indicate the initial interest from an ad unit in your product or service. Typically the higher the number of clicks, the more effective the campaign.
CTR - Click-Through-Rate
Definition: The ratio of clicks to ad impressions. The higher the better
What to look out for: A high CTR is indicative of an effective campaign yet numbers can vary. Make sure to A/B Test different ad sizes and placements to work out which see high CTR levels. Sales/Lead Generation campaigns typically focus more on CTR than higher-level brand awareness campaigns.
Conversions
Definition: Visitors to your site who go on to take a subsequent desired action, whether it be to fill out a form, subscribe, or make a purchase.
What to look out for: Conversions are the ultimate goal. If your website or landing page is receiving visits yet few conversions, these assets require attention (unless your ad itself is misleading). Tools like HotJar for instance can give you a great understanding of where readers are clicking, and overall landing page effectiveness.
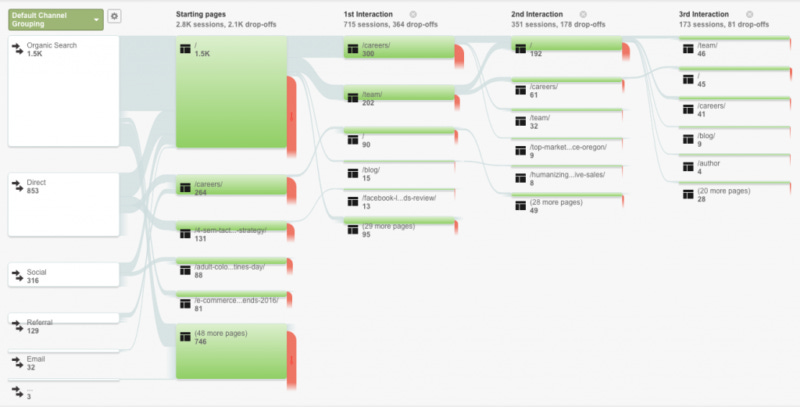
Behaviour Flow
Definition: The path of actions site visitors take through your website or landing page.
What to look out for: Like a trail through a forest, understanding your audience flow can keep your marketing funnel healthy and advertising campaigns effective.
Within Google Analytics the 'Behaviour Flow Report' visualises the path users travel from one Page or Event to the next. This report can help you discover what content keeps users engaged with your site.
Traffic Segments
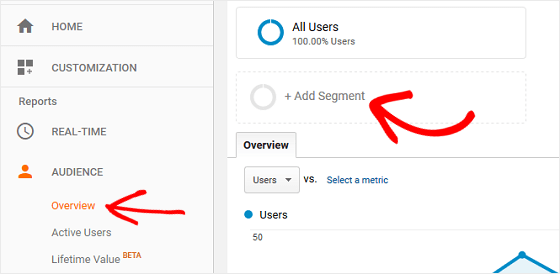
Definition: Traffic Segments are specific cross-sections of your website traffic. eg: Google Search Traffic, or Facebook Referral Traffic.
What to look out for: Isolating specific segments of your traffic and then assessing key metrics like CTR and Conversions can help you understand which traffic sources are providing the most benefit to your business.
If you are using UTM tracking with your DOT Campaigns, it is easy to isolate traffic and performance for these campaigns specifically. Segments are compatible with all areas of Google Analytics including the Behaviour Flow functionality listed above.
About DOT
Founded in 2018, DOT grew from a desire to change digital advertising from the intrusive to the engaging. DOT is now the premier ad technology partner for hundreds of premium media groups globally.
DOT also offer brands from the UK, USA and Western Europe seamless marketing access across several hard-to-reach verticals. To schedule a demo with the team click here.


